
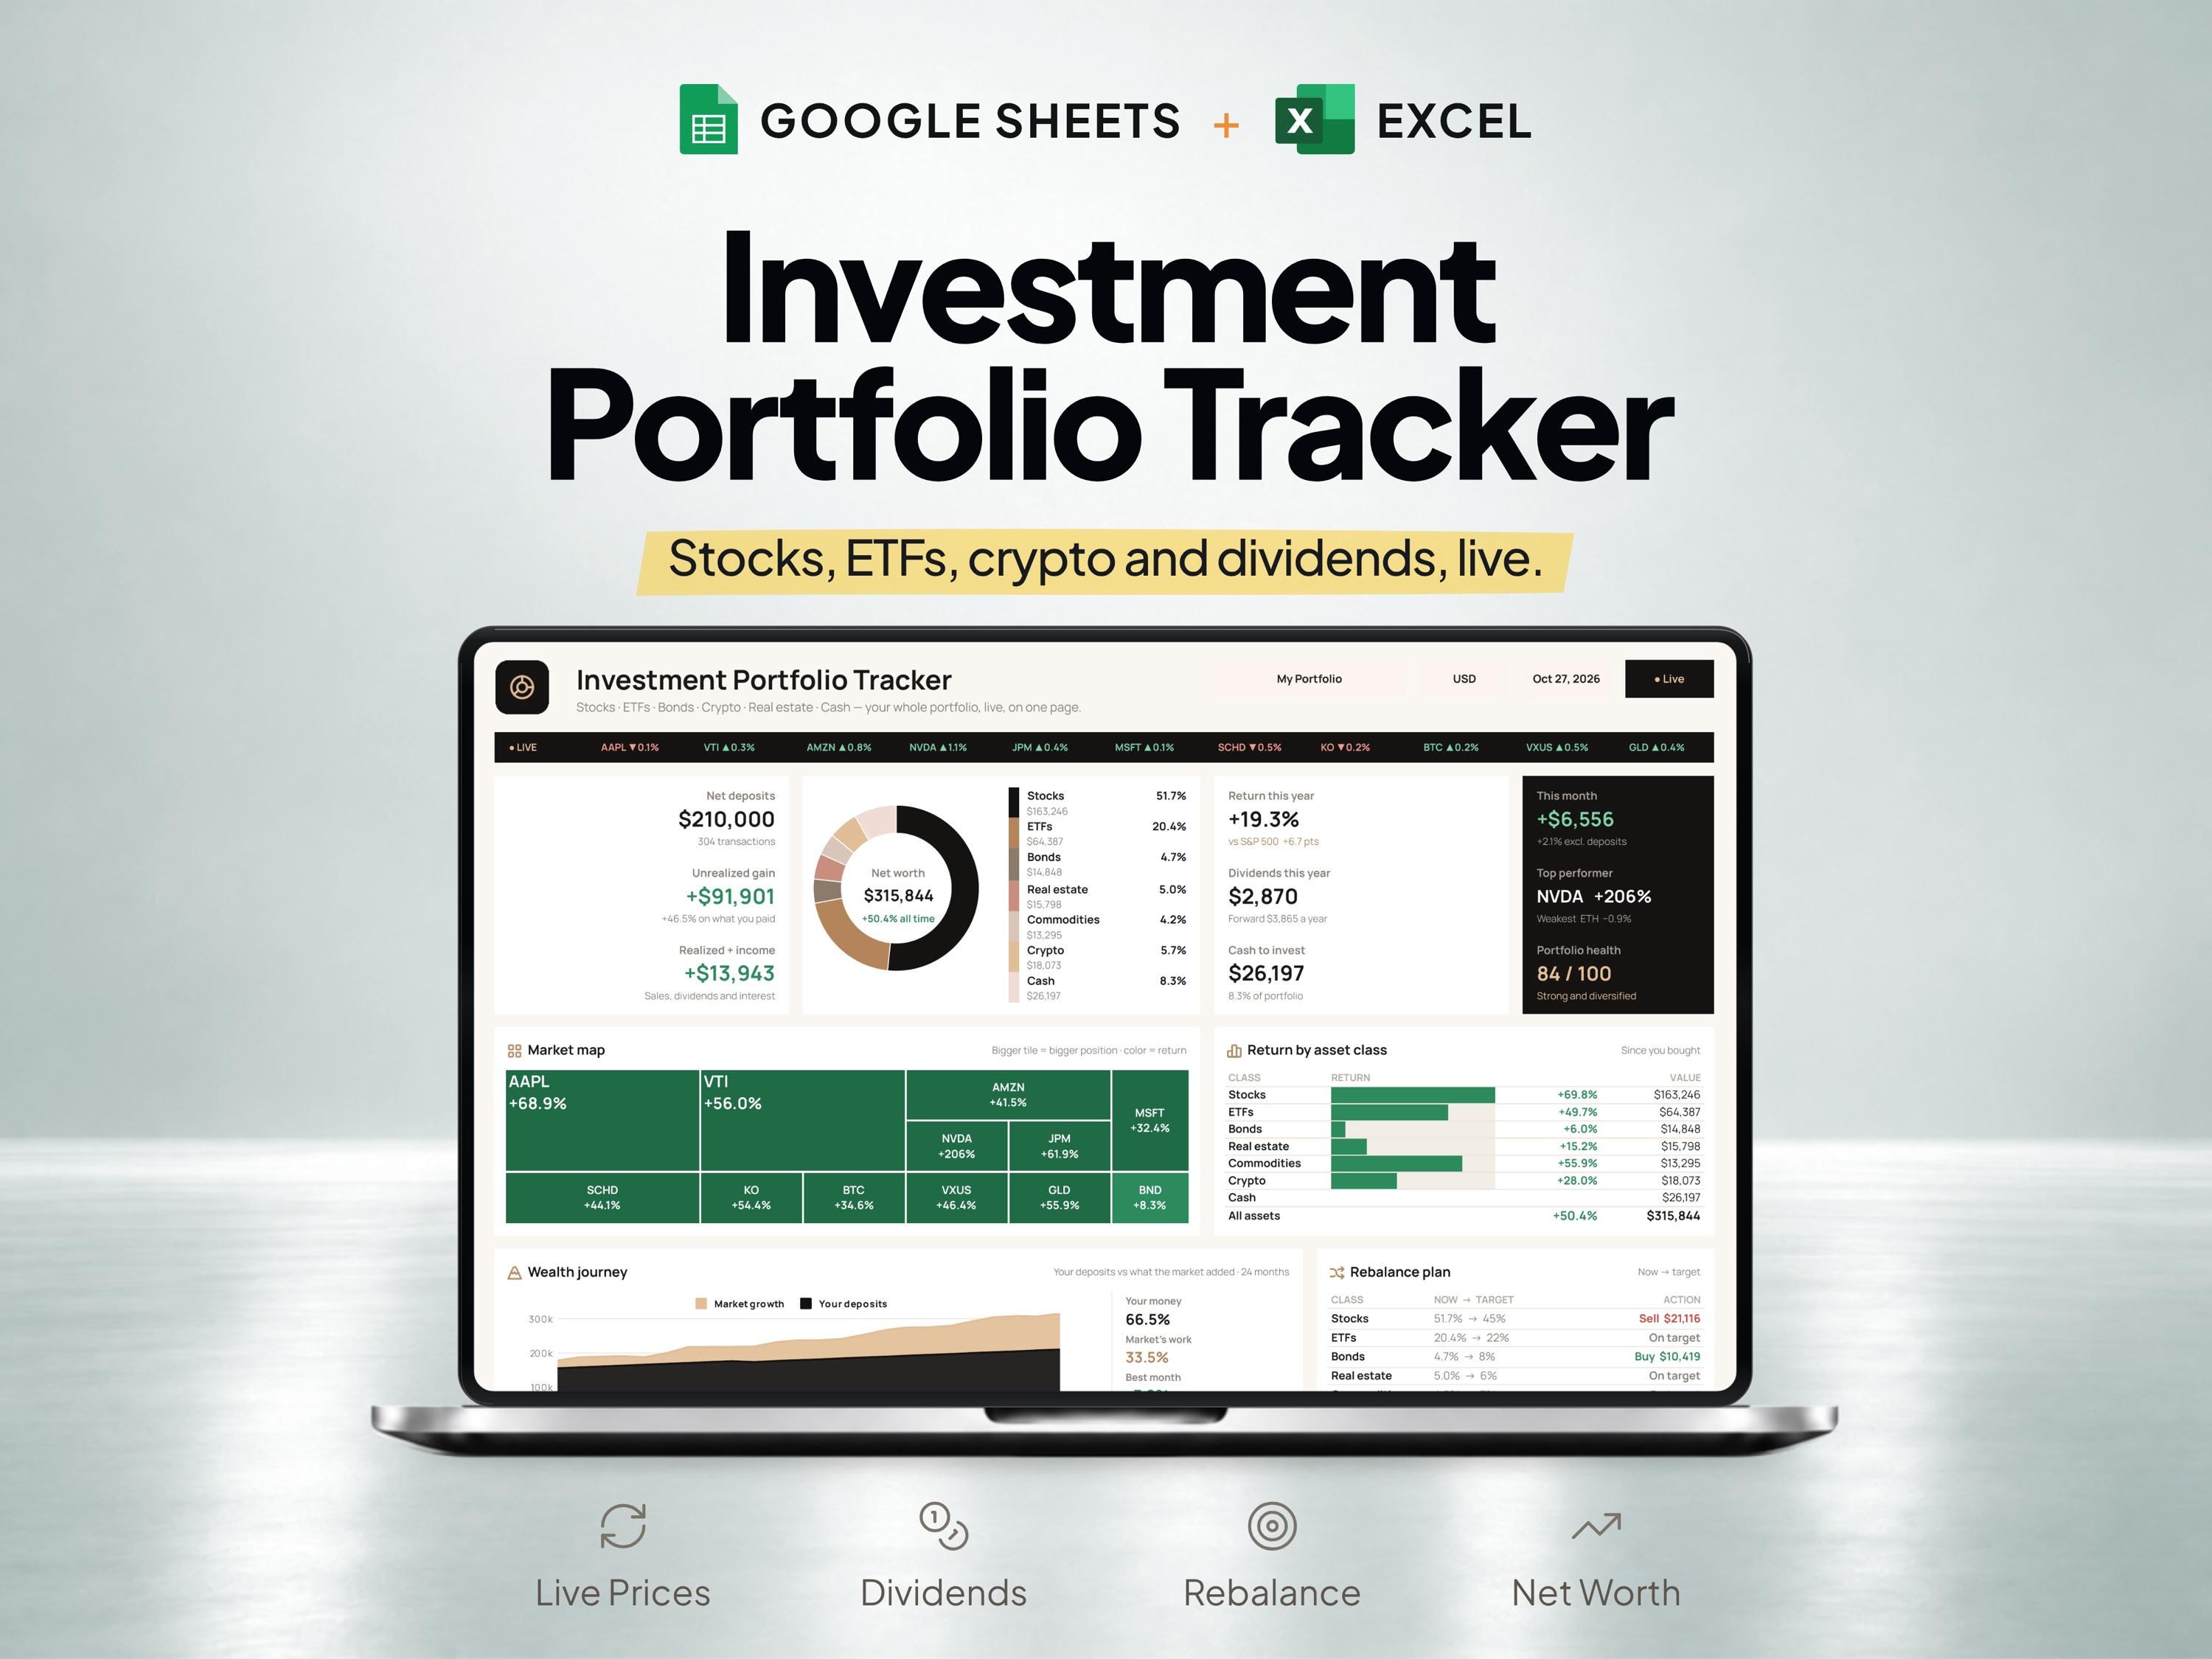
What is included
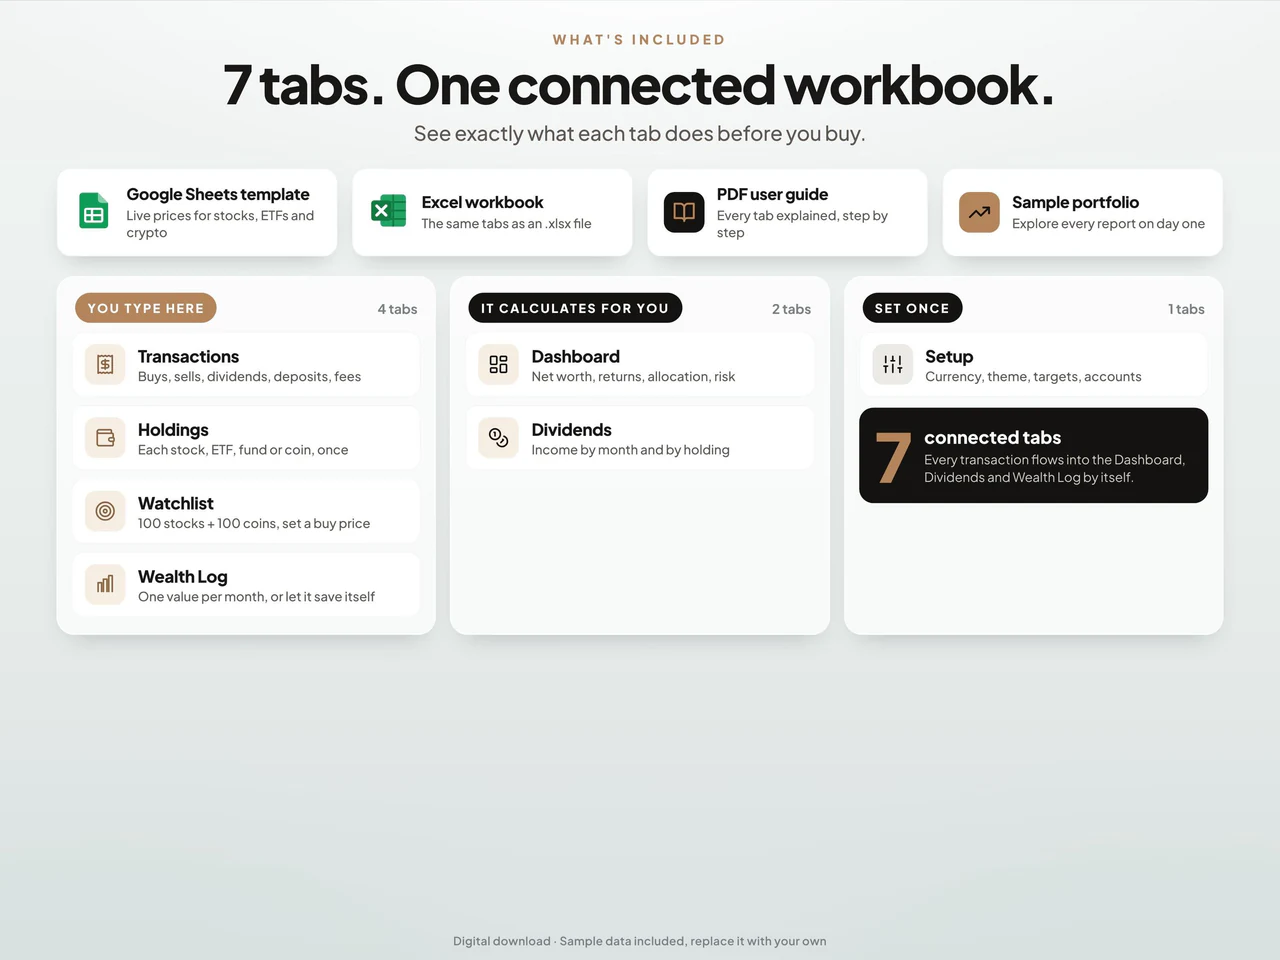
- Seven connected tabs organize transactions, holdings, dividends, monthly wealth records and a watchlist.
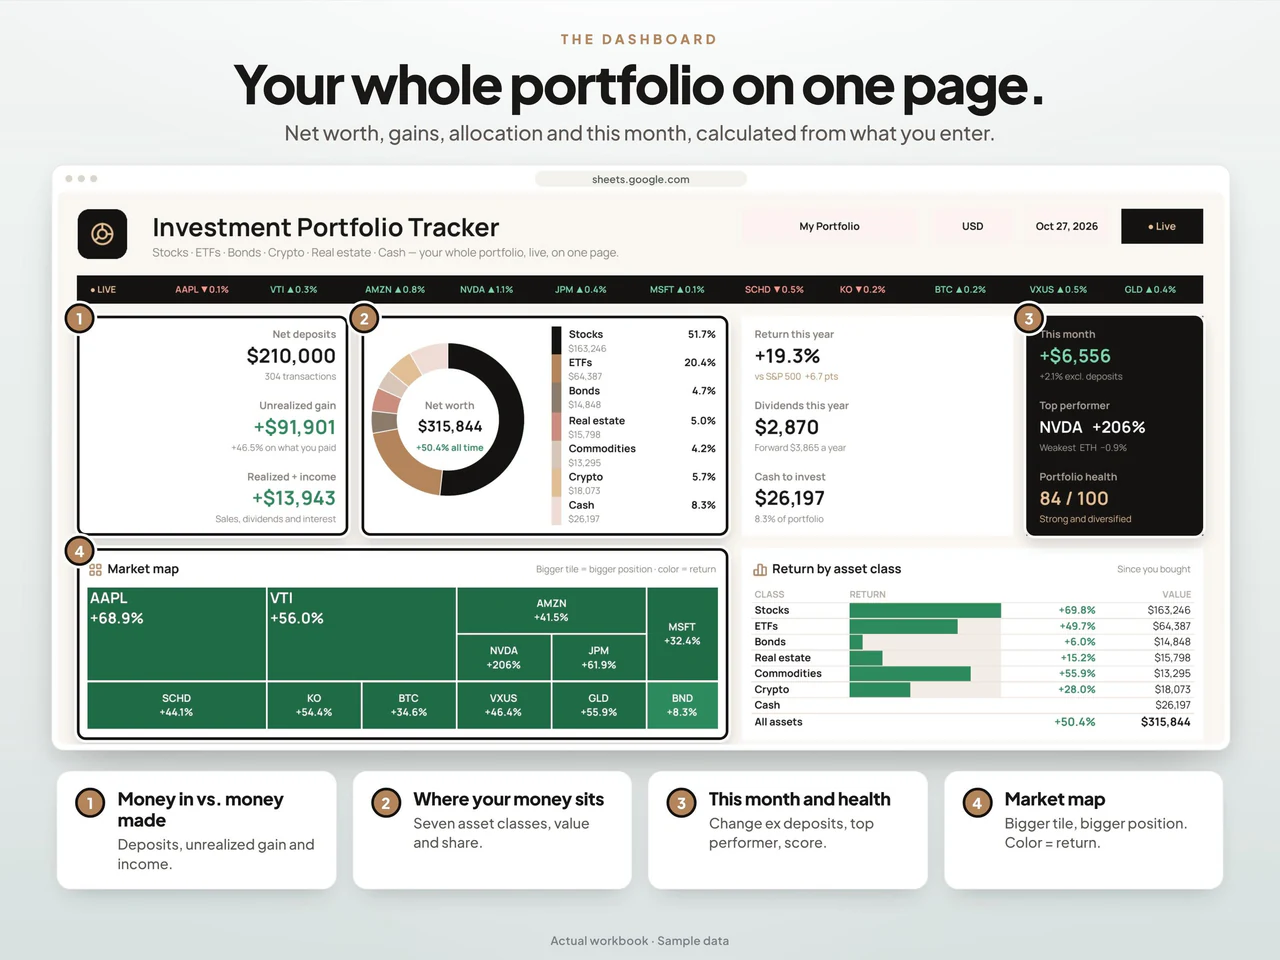
- The dashboard summarizes allocation, recorded returns and progress against the targets you enter.
- Google Sheets supports Google Finance stock/ETF quotes and hourly cryptocurrency updates; stock quotes may be delayed.
- Includes demo and blank Excel workbooks and guides; Excel uses manually entered prices, without the Sheets forms or buttons.
Based on the Etsy listing reviewed October 28, 2026. Check the current listing for any later changes.
What to prepare
For the workflow this product is designed around, gather:
- Holdings and quantities from your account records
- Purchase records and recorded dividend payments
- A consistent date for your net worth snapshot
A practical way to use your records
Start with a dated list of holdings and compare it with your source accounts. Record changes and dividends consistently so later portfolio snapshots remain comparable. Check the current listing for supported price sources before relying on any quoted market values.
A worked example
Fictional example: an investor checks whether a portfolio snapshot agrees with the holdings and cash shown in their own account records.
- Holding A
- 8 units at a recorded snapshot price of $50
- Holding B
- 3 units at a recorded snapshot price of $120
- Cash balance
- $240 on the same snapshot date
- Use the same date for quantities, prices and cash, and retain the source of each snapshot price.
- Check each position's quantity multiplied by its price, then compare the combined figure with the account records.
Result: The illustrative positions total $400 + $360; including $240 cash gives a $1,000 snapshot. This is a record check, not a forecast, investment recommendation or guarantee of live price availability.
Fictional figures explain the workflow; they do not represent customer results or guarantee particular template fields. See the included features above and the current Etsy listing.
A closer look at Investment Portfolio Tracker for Google Sheets & Excel
Additional previews from this product's Etsy listing. Open any image for a larger view.
Questions about this product
Does the tracker cover stocks and crypto?
Yes. Keep stock and crypto records, dividends and net worth together in the portfolio tracker.
Are live price connections included for every asset?
Check the current Etsy listing for supported assets, price sources and refresh intervals before relying on live-price features.
Which spreadsheet formats are listed?
This product is described for Google Sheets and Excel. Confirm the included files, software requirements and delivery instructions on its current Etsy listing.


