
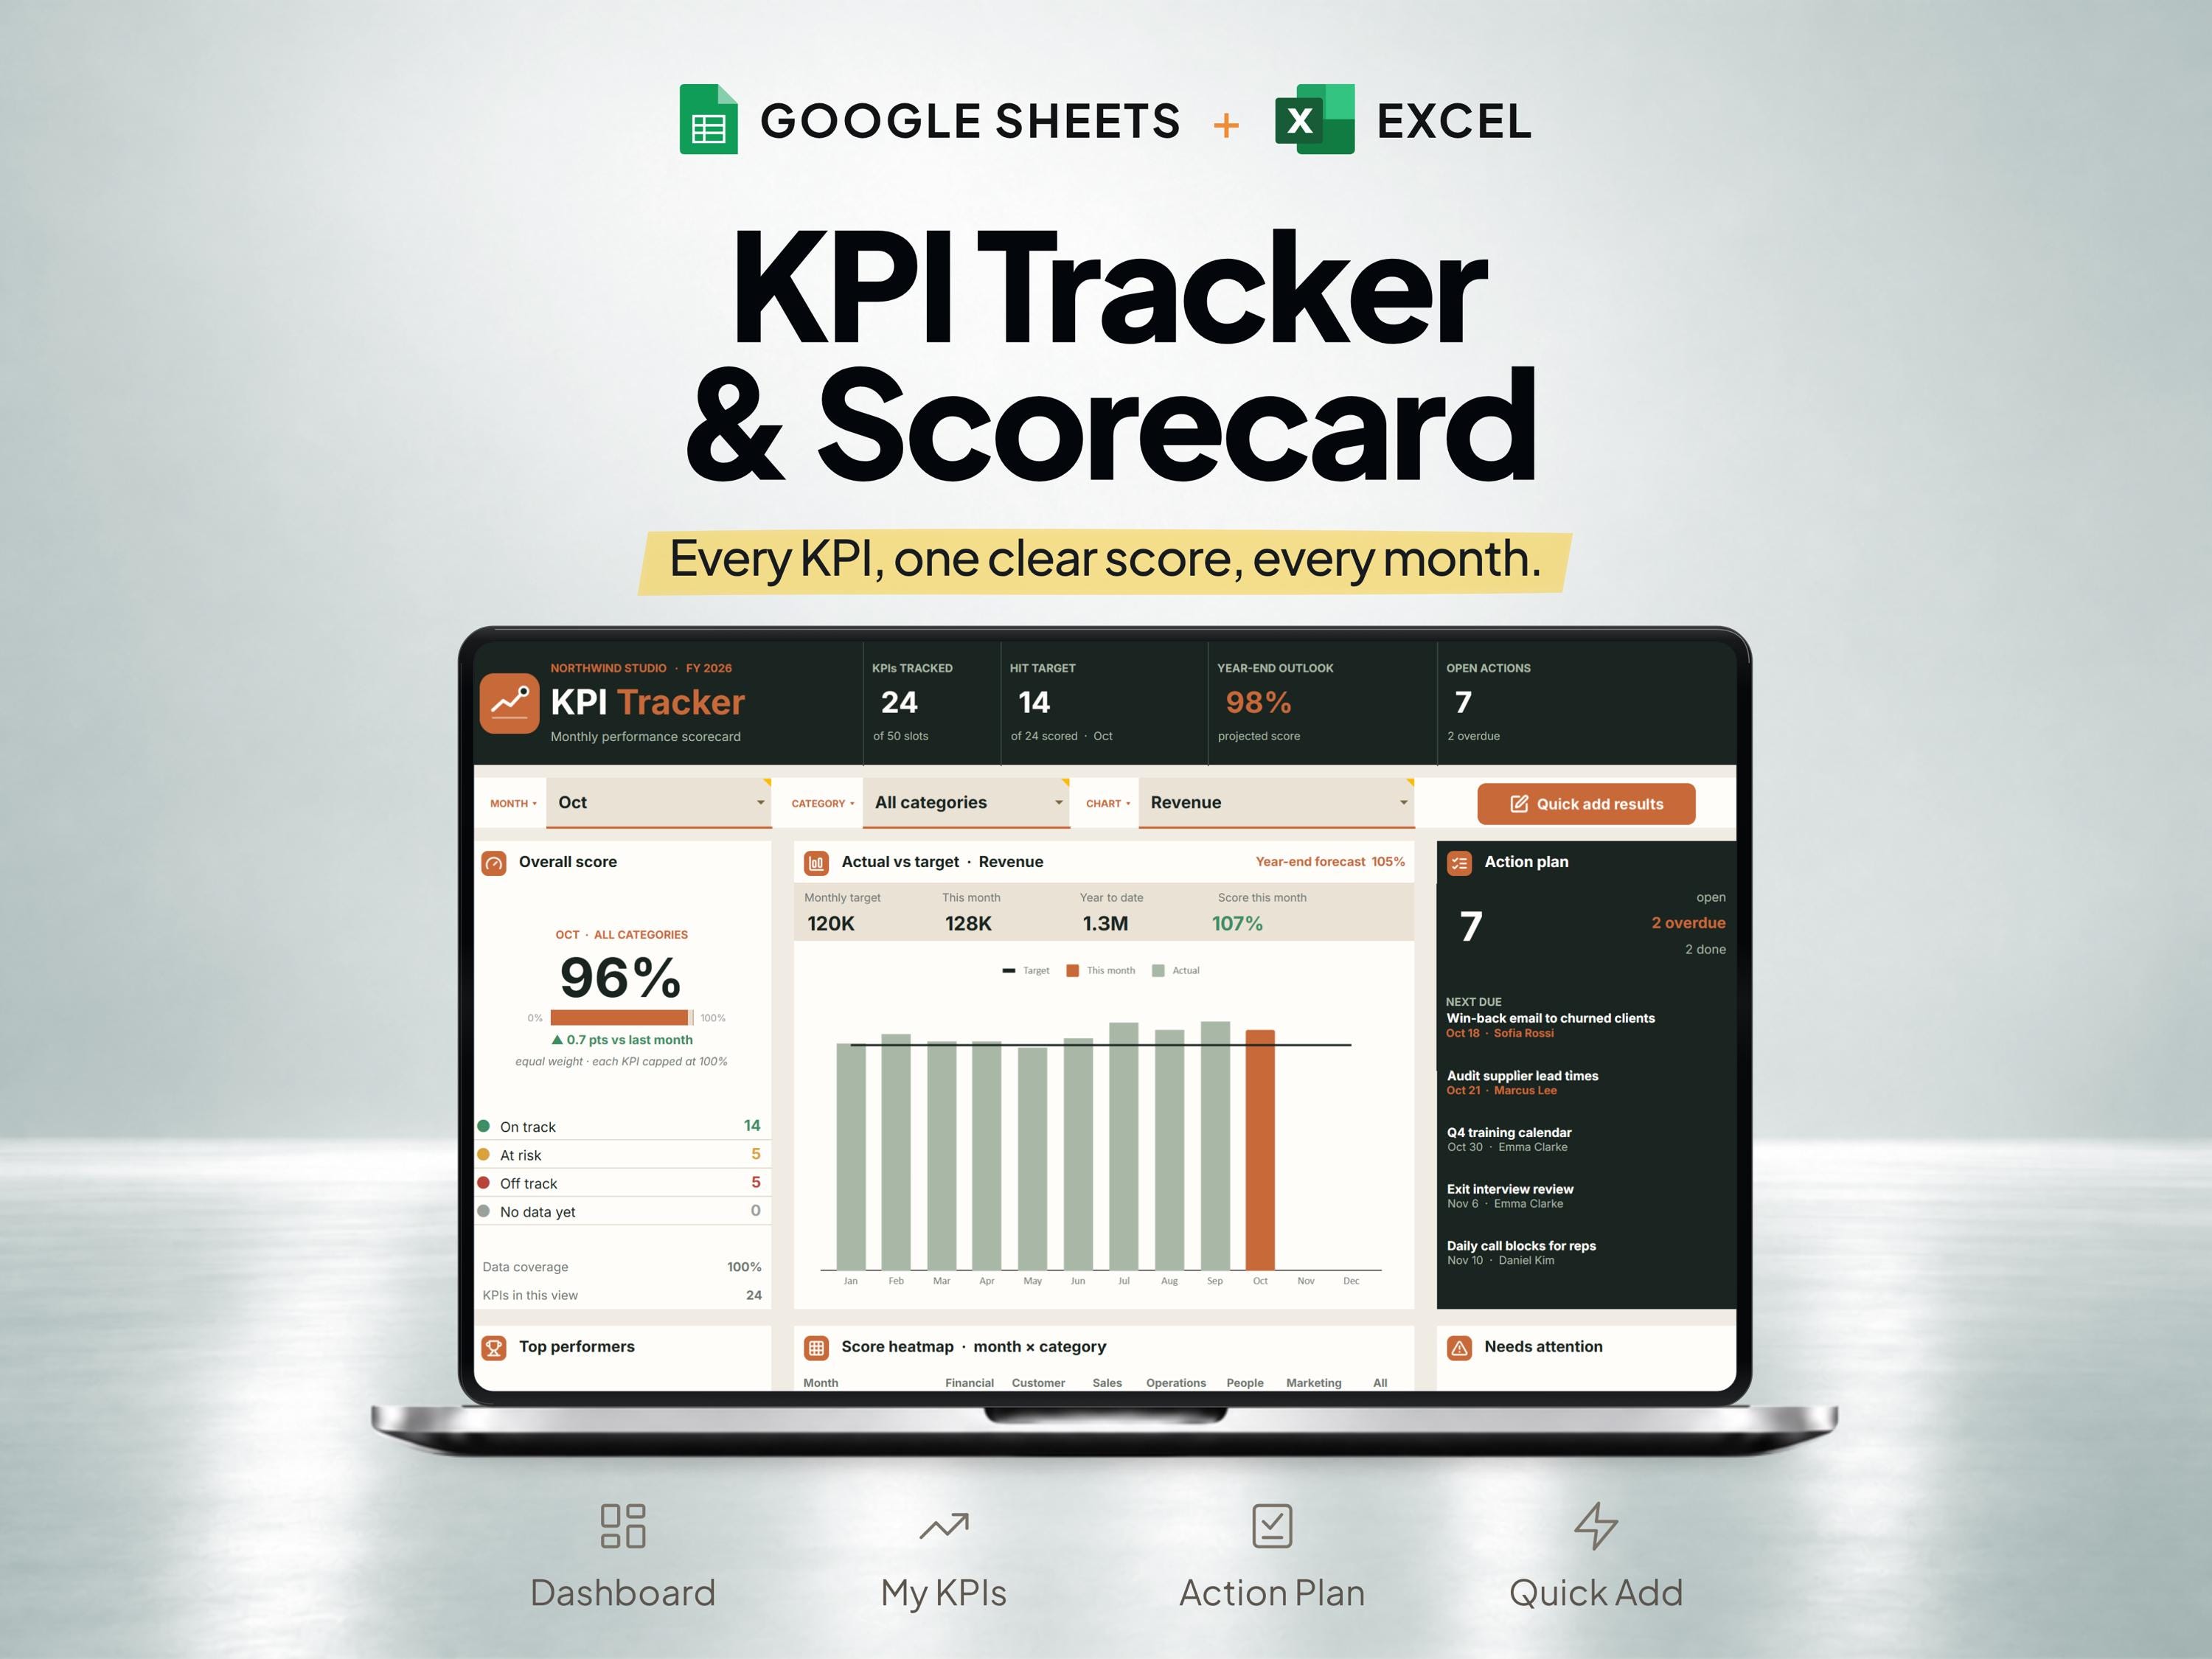
What is included
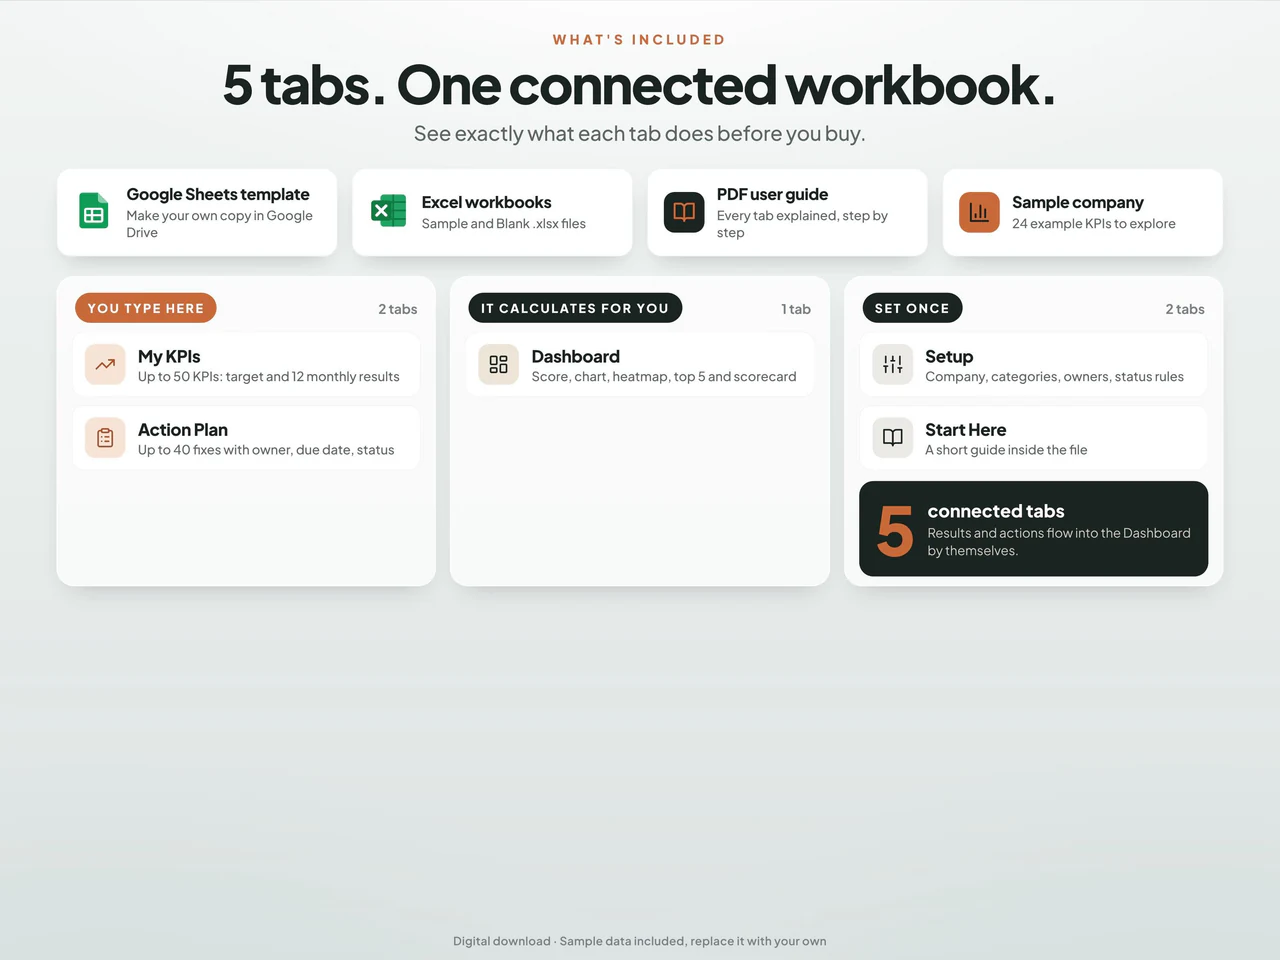
- Records up to 50 KPIs with owners, units, monthly targets and twelve monthly results.
- Scores support both higher-is-better and lower-is-better measures with configurable status thresholds.
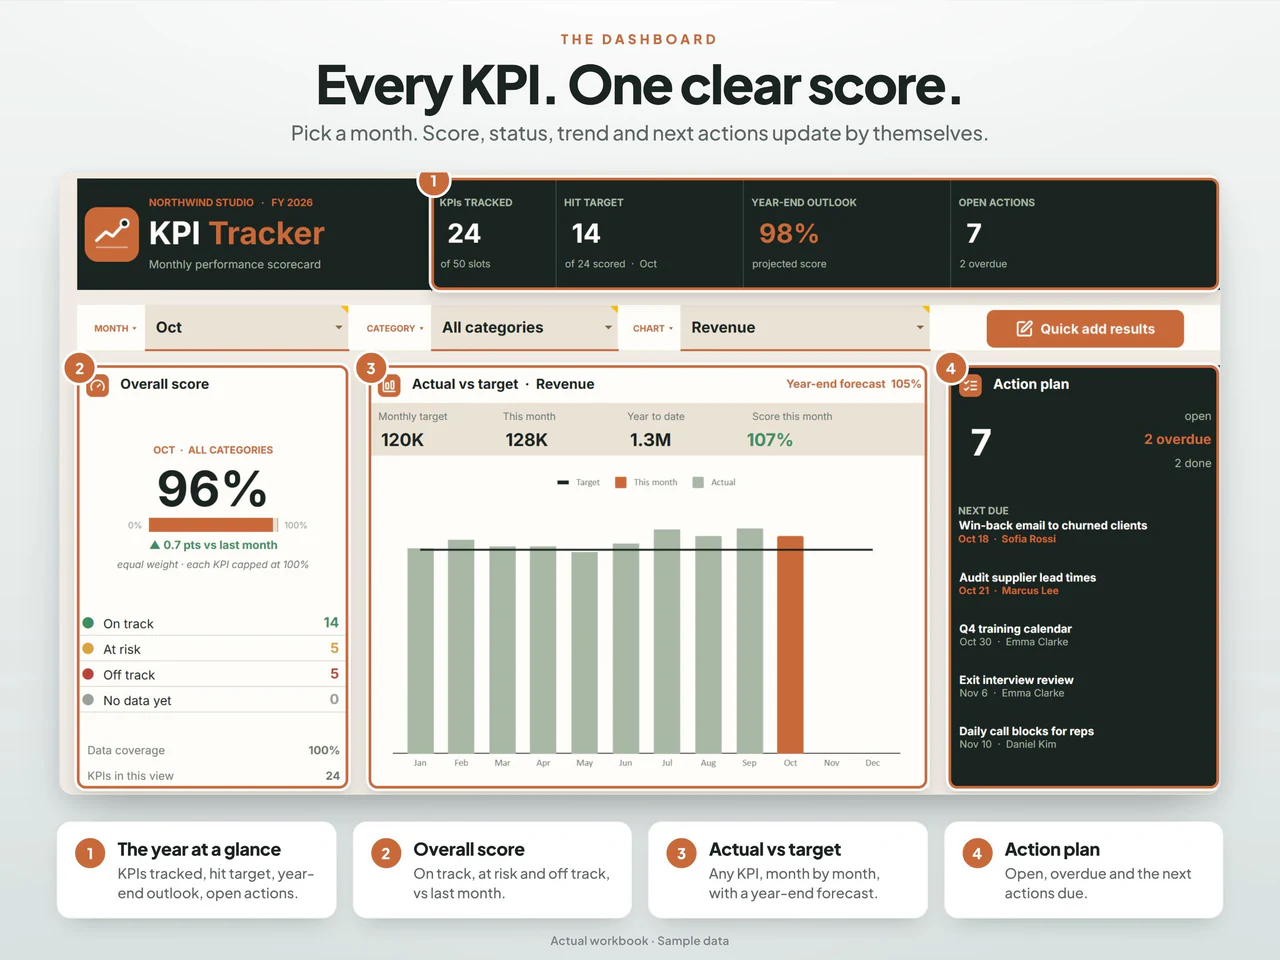
- Dashboard scorecards connect with an action plan containing owners, deadlines and task status.
- Includes Google Sheets and demo/blank Excel; results are entered manually, and Quick Add is a Sheets-only tool.
Based on the Etsy listing reviewed October 28, 2026. Check the current listing for any later changes.
What to prepare
For the workflow this product is designed around, gather:
- The KPIs you intend to review
- The source and definition for each measure
- Recorded sales or business figures for a consistent period
A practical way to use your records
Choose a small set of measures that answer specific business questions. Define how each figure is gathered and use the same period across the scorecard. Review changes with the underlying records rather than assuming every movement has the same cause.
A worked example
Fictional example: a small business checks a conversion KPI using leads and completed sales from the same reporting period.
- Qualified leads counted
- 50 under the team's written definition
- Completed sales counted
- 10 from that same defined group
- Reporting period
- One calendar month
- Calculate the conversion rate from the source lead and sales records using a consistent definition and the same calendar month.
- Enter that monthly result as a percentage KPI in My KPIs, with its owner and the business's chosen target; review the resulting scorecard.
Result: The source calculation is 20%: 10 ÷ 50. The KPI workbook records that monthly result and compares it with its target; this does not assume it imports leads or calculates the underlying conversion automatically.
Fictional figures explain the workflow; they do not represent customer results or guarantee particular template fields. See the included features above and the current Etsy listing.
A closer look at KPI Tracker and Business Scorecard Dashboard for Google Sheets & Excel
Additional previews from this product's Etsy listing. Open any image for a larger view.
Questions about this product
Does the template include a sales tracker?
Yes. A business scorecard, KPI dashboard and sales tracker are included.
Does the dashboard define the right KPIs for my business?
The product provides a workspace for KPI records. You should choose measures and definitions that match the questions your business needs to answer.
Which spreadsheet formats are listed?
This product is described for Google Sheets and Excel. Confirm the included files, software requirements and delivery instructions on its current Etsy listing.


